Interview! Kim Freeman, Professional Missing Cat Finder
May 19, 2018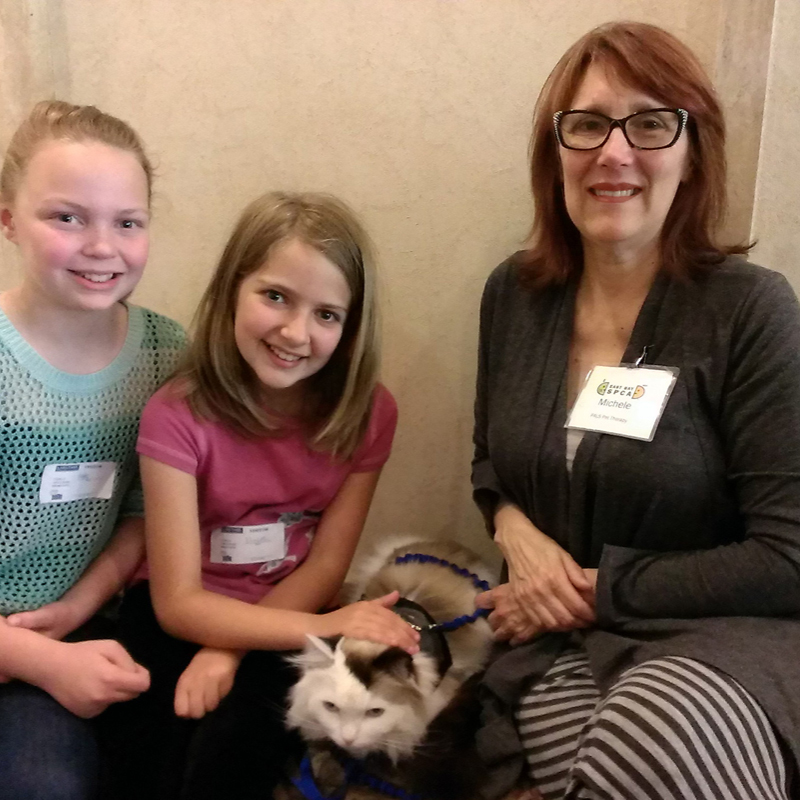
Interview! Michele Tilford, Cat-Assisted Therapy Advocate
May 26, 2018
I recently got an email that Shelter Animals Count had released their summary of statistics collected from 2016. I took a look at those numbers and found some very interesting trends. If you want to take a deep dive into the report, feel free to visit https://shelteranimalscount.org/data/data-reports/2016-animal-sheltering-statistics.
I want to commend the team that worked so hard to put this document together so that we can understand where we are with cats and encourage transparency and working together.
1. Across the country we have an average live release rate for cats of about 75%. As return-to-field programs grow in popularity, I would expect that number to go up fairly quickly.
2. Shelters with government contracts or government animal services that are required to take in cats have it the hardest. Their live release rates are in the mid to low 60% range. Working with these organizations on return-to-field and transfer partners is essential.
3. There is much greater seasonality for cats and kittens than there is for dogs. There is a really cool chart (okay, there are a lot of really cool charts!) that shows that there is indeed a “kitten season” country wide, while the puppy line seems to be pretty stable.
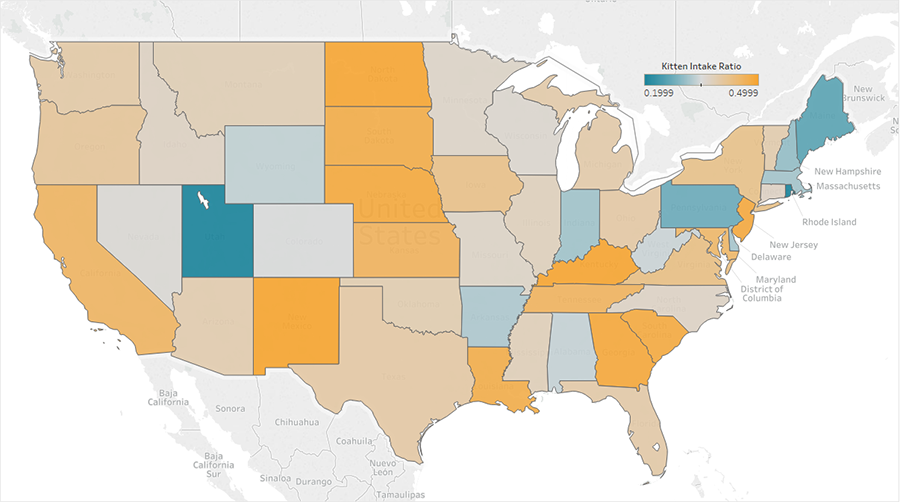
4. I found Figure 7, The Kitten Intake Ratio, extremely fascinating, as it clearly shows that the New England states are solidly displaying that they are in a “kitten-free zone.” This is showing why we have such a shortage of kittens in our shelters and high movement for more transfers in. Farther down in the document, you will see that New York transfers out a lot of cats and kittens, which I feel is helping to serve the supply needs of New England shelters.
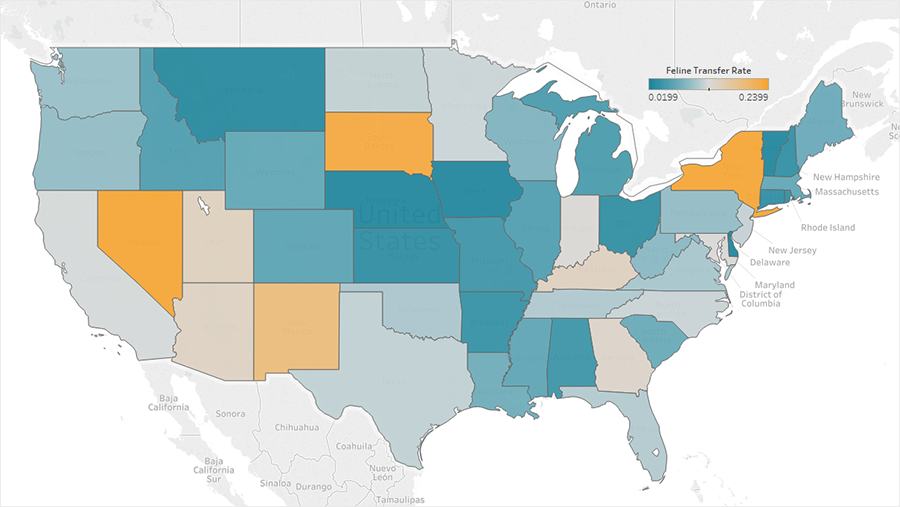
5. Figure 13, Transfers of Cats Out of State, was a learning experience for me. I would have never guessed that New York, Nevada, and South Dakota had the highest rates of transferring out cats and kittens. In the text, the SAC team notes that they are also a bit perplexed by this result. I hope that they look into this further.
6. Return to Owner (RTO) is an unsurprising disappointment. The statistics for RTO continue to be so depressing. Government services seem to have a greater success rate with an average of a 5%, but the more traditional shelters have a dismal 2 or 3%. Don’t even look in the dog column; it will only make you more frustrated. This is certainly an area to which we need to allocate more resources.
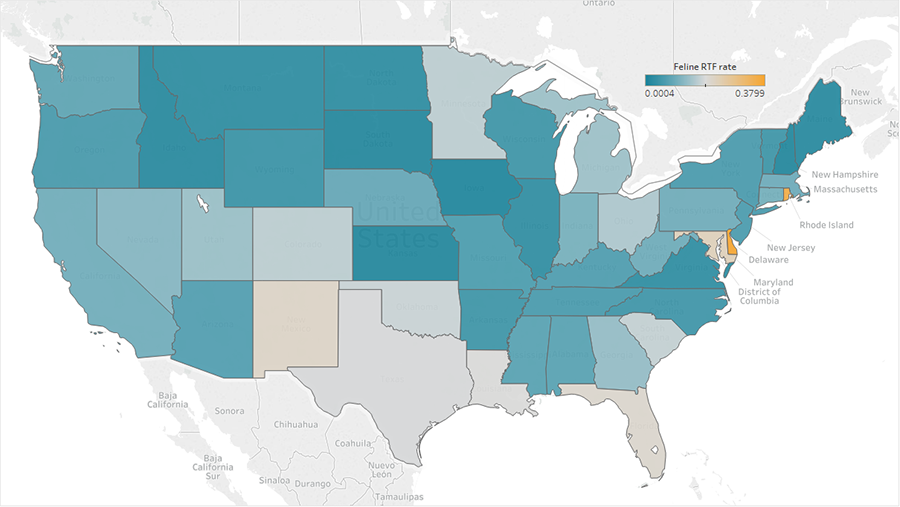
7. Figure 14 shows return-to-field (RTF) rates by state. It shows low levels of RTF across the nation, but as more groups use this as a life- saving program, I believe the map will look very different each year.
I found reading through these numbers incredibly fascinating. You should feel free to use this resource when you are making presentations to the public, your board, and even to your volunteers. Power in numbers — and we finally have some! Thanks to the Shelters Animals Count team and the organizations that support the program.


